See5: An Informal Tutorial
Welcome to See5, a system that extracts informative patterns from data. The following sections show how to prepare data files for See5 and illustrate the options for using the system.
In this tutorial, file names and See5 input appear in
blue fixed-width font
while file extensions and other general forms
are shown highlighted in green.
Buttons and options on the Windows GUI are in maroon.
- Preparing Data for See5
- User Interface
- Constructing Classifiers
- Using Classifiers
- Cross-Referencing Classifiers and Data
- Generating Classifiers in Batch Mode
- Linking to Other Programs
Preparing Data for See5
We will illustrate See5 using a medical application -- mining a database of thyroid assays from the Garvan Institute of Medical Research, Sydney, to construct diagnostic rules for hypothyroidism. Each case concerns a single referral and contains information on the source of the referral, assays requested, patient data, and referring physician's comments. Here are three examples:
        Attribute                 Case 1    Case 2    Case 3    .....

	age                       41        23        46
	sex                       F         F         M
	on thyroxine              f         f         f
	query on thyroxine        f         f         f
	on antithyroid medication f         f         f
	sick                      f         f         f
	pregnant                  f         f         not applicable
	thyroid surgery           f         f         f
	I131 treatment            f         f         f
	query hypothyroid         f         f         f
	query hyperthyroid        f         f         f
	lithium                   f         f         f
	tumor                     f         f         f
	goitre                    f         f         f
	hypopituitary             f         f         f
	psych                     f         f         f
	TSH                       1.3       4.1       0.98
	T3                        2.5       2         unknown
	TT4                       125       102       109
	T4U                       1.14      unknown   0.91
	FTI                       109       unknown   unknown
	referral source           SVHC      other     other
	diagnosis                 negative  negative  negative
	ID                        3733      1442      2965
This is exactly the sort of task for which See5 was designed. Each case belongs to one of a small number of mutually exclusive classes (negative, primary, secondary, compensated). Properties of every case that may be relevant to its class are provided, although some cases may have unknown or non-applicable values for some attributes. There are 24 attributes in this example, but See5 can deal with any number of attributes.
See5's job is to find how to predict a case's class from the values of the other attributes. See5 does this by constructing a classifier that makes this prediction. As we will see, See5 can construct classifiers expressed as decision trees or as sets of rules.
Application files
Every See5 application has a short name called a filestem; we will use the filestemhypothyroid
for this illustration.
All files read or written by See5 for an application
have names of the form
filestem.extension,
where filestem identifies the application and
extension describes the contents of the file.
Here is a summary table of the extensions used by See5 (to be described in later sections):
| names | description of the application's attributes | [required] |
| data | cases used to generate a classifier | [required] |
| test | unseen cases used to test a classifier | [optional] |
| cases | cases to be classified subsequently | [optional] |
| costs | differential misclassification costs | [optional] |
| tree | decision tree classifier produced by See5 | [output] |
| rules | ruleset classifier produced by See5 | [output] |
| out | report produced when a classifier is generated | [output] |
| set | settings used for the last classifier | [output] |
APP.DATA,
app.data, and App.Data, are all different.
The extensions must be written
in lower case as shown above, otherwise See5 will not recognize
the files for your application.
If See5 cannot seem to find your files even though the filestem
and extensions are correct, please
check that file extensions are not hidden on your computer.
(If extensions are hidden and you write a text file from Wordpad,
it automatically adds an extension .txt that makes the file
invisible to See5.)
Names file
Two files are essential for all See5 applications and there are three further optional files, each identified by its extension. The first essential file is the names file (e.g.hypothyroid.names) that
describes the attributes and classes.
There are two important subgroups of attributes:
- The value of an explicitly-defined attribute is given directly in the data in one of several forms. A discrete attribute has a value drawn from a set of nominal values, a continuous attribute has a numeric value, a date attribute holds a calendar date, a time attribute holds a clock time, a timestamp attribute holds a date and time, and a label attribute serves only to identify a particular case.
- The value of an implicitly-defined attribute is specified by a formula.
The file hypothyroid.names
looks like this:
diagnosis.                     | the target attribute

age:                           continuous.
sex:                           M, F.
on thyroxine:                  f, t.
query on thyroxine:            f, t.
on antithyroid medication:     f, t.
sick:                          f, t.
pregnant:                      f, t.
thyroid surgery:               f, t.
I131 treatment:                f, t.
query hypothyroid:             f, t.
query hyperthyroid:            f, t.
lithium:                       f, t.
tumor:                         f, t.
goitre:                        f, t.
hypopituitary:                 f, t.
psych:                         f, t.
TSH:                           continuous.
T3:                            continuous.
TT4:                           continuous.
T4U:                           continuous.
FTI:=                          TT4 / T4U.
referral source:               WEST, STMW, SVHC, SVI, SVHD, other.

diagnosis:                     primary, compensated, secondary, negative.

ID:                            label.
What's in a name?
Names, labels, classes, and discrete values are represented by arbitrary strings of characters, with some fine print:- Tabs and spaces are permitted inside a name or value, but See5 collapses every sequence of these characters to a single space.
- Special characters (comma, colon, period, vertical bar `
|') can appear in names and values, but must be prefixed by the escape character `\'. For example, the name "Filch, Grabbit, and Co." would be written as` . (Colons in times and periods in numbers do not need to be escaped.)Filch\, Grabbit\, and Co\.'
|'
causes the remainder of the line to be ignored and is handy for
including comments.
This use of `|' should not occur inside a value.
Specifying the classes
The first entry in the names file specifies the classes in one of three formats:- A list of class names separated by commas, e.g.
primary, compensated, secondary, negative. - The name of a discrete attribute (the target attribute)
that contains the class value, e.g.:
diagnosis. - The name of a continuous target attribute followed by a colon and
one or more thresholds in increasing order and separated by commas.
If there are t thresholds
X1, X2, ..., Xt
then the values of the attribute are divided into
t+1 ranges:
- less than or equal to X1
- greater than X1 and less than or equal to X2
- . . .
- greater than Xt.
age: 12, 19.
age <= 12,12 < age <= 19, andage > 19.
This first entry defining the classes is followed by definitions of the attributes in the order that they will be given for each case.
Explicitly-defined attributes
The name of each explicitly-defined attribute is followed by a colon `:' and a description of the values taken by the attribute.
The attribute name is arbitrary, except that each attribute must have
a distinct name, and case weight
is reserved for setting weights for individual cases.
There are eight possibilities for the description of attribute values:
continuous- The attribute takes numeric values.
date- The attribute's values are dates in the form YYYY/MM/DD
or YYYY-MM-DD,
e.g.
2005/09/30or2005-09-30. time- The attribute's values are times in the form HH:MM:SS
with values between
00:00:00and23:59:59. timestamp- The attribute's values are times in the form
YYYY/MM/DD HH:MM:SS or
YYYY-MM-DD HH:MM:SS,
e.g.
2005-09-30 15:04:00. (Note that there is a space separating the date and time.) - a comma-separated list of names
- The attribute takes discrete values, and these are the allowable values.
The values may be prefaced by
[ordered]to indicate that they are given in a meaningful ordering, otherwise they will be taken as unordered. For instance, the valueslow, medium, highare ordered, whilemeat, poultry, fish, vegetablesare not. The former might be declared asgrade: [ordered] low, medium, high.
discreteN for some integer N- The attribute has discrete, unordered values, but the values are assembled from the data itself; N is the maximum number of such values. This form can be handy for unordered discrete attributes with many values, but its use means that the data values cannot be checked. (NB: This form cannot be used for the target attribute.)
ignore- The values of the attribute should be ignored.
label- This attribute contains an identifying label for each case, such as an account number or an order code. The value of the attribute is ignored when classifiers are constructed, but is used when referring to individual cases. A label attribute can make it easier to locate errors in the data and to cross-reference results to individual cases. If there are two or more label attributes, only the last is used.
Attributes defined by formulas
The name of each implicitly-defined attribute is followed by `:='
and then a formula defining the attribute value. The formula is
written in the usual way, using parentheses where needed, and
may refer to any attribute defined up to this point.
Constants in the formula can be
numbers written in decimal notation, dates, times,
and discrete attribute values enclosed in string quotes `"'.
The operators and functions that can be used in the formula are
-
+,-,*,/,%(mod),^(meaning `raised to the power') -
>,>=,<,<=,=,<>or!=(both meaning `not equal') -
and,or -
sin(...),cos(...),tan(...),log(...),exp(...),int(...)(meaning `integer part of')
FTI:= TT4 / T4U.
strange := referral source = "WEST" or age > 40.
t or f
since the value given by the formula is either true or false.
If the value of the formula cannot be determined for a particular case because one or more of the attributes appearing in the formula have unknown or non-applicable values, the value of the implicitly-defined attribute is unknown.
Dates, times, and timestamps
Dates are stored by See5 as the number of days since a particular starting point so some operations on dates make sense. Thus, if we have attributes d1: date.
d2: date.
	interval := d2 - d1.
	gap := d1 <= d2 - 7.
	d1-day-of-week := (d1 + 1) % 7 + 1.
interval then represents the number of days from
d1 to d2 (non-inclusive) and
gap would have a true/false value signaling whether
d1 is at least a week before d2.
The last definition is a slightly non-obvious way of determining
the day of the week on which d1 falls, with values
ranging from 1 (Monday) to 7 (Sunday).
Similarly, times are stored as the number of seconds since midnight.
If the names file includes
	start: time.
	finish: time.
	elapsed := finish - start.
elapsed is the number of seconds
from start to finish.
Timestamps are a little more complex. A timestamp is rounded to
the nearest minute, but limitations on the precision of floating-point
numbers mean that the values stored for timestamps from more than
thirty years ago are approximate.
If the names file includes
	departure: timestamp.
	arrival: timestamp.
	flight time := arrival - departure.
flight time is the number of minutes
from departure to arrival.
Selecting the attributes that can appear in classifiers
An optional final entry in the names file affects the way that See5 constructs classifiers. This entry takes one of the forms attributes included:
attributes excluded:
Excluding an attribute from classifiers is not the same as ignoring the
attribute (see `ignore' above).
As an example, suppose that numeric attributes A
and B
are defined in the data, but background knowledge suggests that
only their difference is important.
The names file might then contain the following entries:
. . .In this example the attributesA: continuous.B: continuous.Diff := A - B.. . .attributes excluded: A, B.
A and B
could not be defined
as ignore because the definition of Diff
would then be invalid.
Data file
The second essential file, the application's data file (e.g.hypothyroid.data)
provides information on the
training
cases from which See5 will extract patterns.
The entry for each case consists of one or more lines that give
the values for all explicitly-defined attributes. If the classes are listed
in the first line of the names file,
the attribute values are followed by the case's class value.
Values are separated by commas and the entry is optionally terminated by
a period.
Once again, anything on a line after a vertical bar `|'
is ignored.
(If the information for a case occupies more than one line, make sure
that the line breaks occur after commas.)
For example,
the first three cases from file
hypothyroid.data are:
	41,F,f,f,f,f,f,f,f,f,f,f,f,f,f,f,1.3,2.5,125,1.14,SVHC,negative,3733
	23,F,f,f,f,f,f,f,f,f,f,f,f,f,f,f,4.1,2,102,?,other,negative,1442
	46,M,f,f,f,f,N/A,f,f,f,f,f,f,f,f,f,0.98,?,109,0.91,other,negative,2965
Notice that
`?' is used to denote a value that is missing or unknown.
Similarly, `N/A' denotes a value that is not applicable for
a particular case.
Also note
that the cases do not contain values for the attribute FTI
since its values are computed from other attribute values.
Test and cases files (optional)
Of course, the value of predictive patterns lies in their ability to make accurate predictions! It is difficult to judge the accuracy of a classifier by measuring how well it does on the cases used in its construction; the performance of the classifier on new cases is much more informative. (For instance, any number of gurus tell us about patterns that `explain' the rise/fall behavior of the stock market in the past. Even though these patterns may appear plausible, they are only valuable to the extent that they make useful predictions about future rises and falls.)
The third kind of file used
by See5 consists of new test
cases (e.g. hypothyroid.test) on which the classifier
can be evaluated.
This file is optional and, if used, has
exactly the same format as the data file.
Another optional file, the cases file
(e.g. hypothyroid.cases),
differs from a test file only in allowing the cases'
classes to be unknown (`?').
The cases file is used primarily with
the cross-referencing procedure and public source code,
both of which are
described later on under linking to other programs.
Costs file (optional)
The last kind of file, the costs file (e.g.hypothyroid.costs),
is also optional and sets out
differential misclassification costs.
In some applications
there is a much higher penalty for certain types of mistakes.
In this application, a prediction that hypothyroidism is not present
could be very costly if in fact it is.
On the other hand, predicting incorrectly that a patient is
hypothyroid
may be a less serious error.
See5 allows different misclassification
costs to be associated with each combination of real class and
predicted class. We will return to this topic near the end of the
tutorial.
User Interface
It is difficult to see what is going on in an interface without actually using it. As a simple illustration, here is the main window of See5 after the hypothyroid application has been selected.
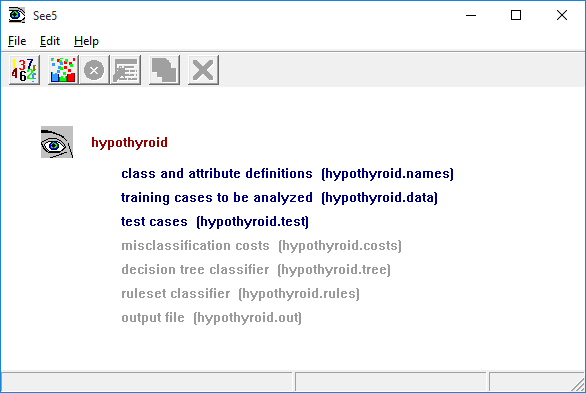
The main window of See5 has six buttons on its toolbar. From left to right, they are
- Locate Data
- invokes a browser to find the files for your application, or to change the current application;
- Construct Classifier
- selects the type of classifier to be constructed and sets other options;
- Stop
- interrupts the classifier-generating process;
- Review Output
- re-displays the output from the last classifier construction (if any);
- Use Classifier
- interactively applies the current classifier to one or more cases; and
- Cross-Reference
- shows how cases in training or test data relate to (parts of) a classifier and vice versa.
The Edit menu facilities changes to the names and costs files after an application's files have been located. On-line help is available through the Help menu.
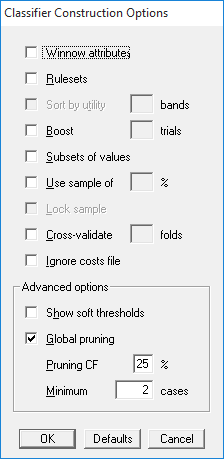
Constructing Classifiers
Once the names, data, and optional files have been set up, everything is ready to use See5.The first step is to browse to find the application's data files using the Locate Data button on the toolbar (or the corresponding selection from the File menu). We will assume that the hypothyroid data above has been located in this manner.
There are several options that affect the type of classifier that See5 produces and the way that it is constructed. The Construct Classifier button on the toolbar (or selection from the File menu) displays a dialog box that sets out these classifier construction options:
Decision trees
When See5 is invoked with the default values of all options, it constructs a decision tree and generates output like this:
See5 [Release 2.11a]    Sun Apr  7 08:48:18 2019

Class specified by attribute `diagnosis'

Read 2772 cases (24 attributes) from hypothyroid.data

Decision tree:

TSH <= 6: negative (2472/2)
TSH > 6:
:...FTI <= 65.3:
    :...thyroid surgery = t: negative (4.2/2)
    :   thyroid surgery = f:
    :   :...TT4 <= 61: primary (51/3.7)
    :       TT4 > 61:
    :       :...referral source in {WEST,SVHD}: primary (0)
    :           referral source in {STMW,SVHC,SVI}: primary (4.9/0.8)
    :           referral source = other:
    :           :...TSH <= 22: negative (6.4/2.7)
    :               TSH > 22: primary (5.8/0.8)
    FTI > 65.3:
    :...on thyroxine = t: negative (37.7)
        on thyroxine = f:
        :...thyroid surgery = t: negative (6.8)
            thyroid surgery = f:
            :...TT4 > 153: negative (6/0.1)
                TT4 <= 153:
                :...TT4 <= 37: primary (2.5/0.2)
                    TT4 > 37: compensated (174.6/24.8)


Evaluation on training data (2772 cases):

            Decision Tree
          ----------------
          Size      Errors

            11    8( 0.3%)   <<


           (a)   (b)   (c)   (d)    <-classified as
          ----  ----  ----  ----
            58     3           2    (a): class primary
                 154                (b): class compensated
                               2    (c): class secondary
                   1        2552    (d): class negative


        Attribute usage:

             90%  TSH
             18%  thyroid surgery
             18%  on thyroxine
             14%  TT4
             13%  T4U
             13%  FTI
              7%  referral source


Evaluation on test data (1000 cases):

            Decision Tree
          ----------------
          Size      Errors

            11    3( 0.3%)   <<


           (a)   (b)   (c)   (d)    <-classified as
          ----  ----  ----  ----
            31     1                (a): class primary
             1    39                (b): class compensated
                                    (c): class secondary
                   1         927    (d): class negative


Time: 0.0 secs
The first line identifies the version of See5 and the run date.
See5 constructs a decision tree from the 2772 training cases
in the file hypothyroid.data, and this appears next.
Although it may not look much like a tree, this output can be
paraphrased as:
   if TSH is less than or equal to 6 then negative
        else
        if TSH is greater than 6 then
            if FTI is less than or equal to 65.3 then
	        if thyroid surgery is true then negative
		else
		if thyroid surgery is false then
		    if TT4 is less than or equal to 61 then primary
		    else
		    if TT4 is greater than 61 then
			. . . .
and so on.
Please note: This explanation oversimplifies threshold tests such as
TSH <= 6; the details are discussed later in the section
Soft thresholds.
The tree employs a case's attribute values to map it
to a leaf designating one of the classes.
Every leaf of the tree is followed by a cryptic (n) or
(n/m).
For instance, the last leaf of the decision tree
is compensated (174.6/24.8), for which n is 174.6 and
m is 24.8.
The value of n is the number of cases in the file
hypothyroid.data
that are mapped to this leaf, and m (if it appears) is the number of
them that are classified incorrectly by the leaf.
(A non-integral number of cases can arise because, when the value of
an attribute in the tree is not known, See5 splits the case
and sends a fraction down each branch.)
The next section covers the evaluation of this decision tree shown in the second part of the output. Before we leave this output, though, its final line states the elapsed time for the run. A decision tree is usually constructed quickly, even when there are many thousands of cases. Some of the options described later, such as ruleset generation and boosting, can slow things down considerably.
Evaluation
Classifiers constructed by See5 are evaluated on the training data from which they were generated, and also on a separate file of unseen test cases if available; evaluation by cross-validation is discussed later.
Results of the decision tree on the cases in
hypothyroid.data are:
            Decision Tree
          ----------------
          Size      Errors

            11    8( 0.3%)   <<
Size is the number of non-empty leaves on the
tree and
Errors shows
the number and percentage of cases misclassified.
The tree, with 11 leaves, misclassifies 8 of the 2772 given cases, an error
rate of 0.3%.
This might seem inconsistent with the errors recorded at the leaves --
the leaf mentioned above shows 24.8 errors! The discrepancy arises because
parts of a case split as a result of unknown attribute values can
be misclassified and yet, when the votes from all the parts are aggregated,
the correct class can still be chosen.
When there are no more than twenty classes, performance on the training cases is further analyzed in a confusion matrix that pinpoints the kinds of errors made.
           (a)   (b)   (c)   (d)    <-classified as
          ----  ----  ----  ----
            58     3           2    (a): class primary
                 154                (b): class compensated
                               2    (c): class secondary
                   1        2552    (d): class negative
In this example, the decision tree misclassifies
-
three of the
primarycases ascompensatedand two of them asnegative, -
both
secondarycases asnegative, and -
one
negativecase ascompensated.
When the number of classes is larger than twenty, a summary of performance broken down by class is shown instead. The entry for each class shows the number of cases for that class and the numbers of false positives and false negatives. A false positive for class C is a case of another class that is classified as C, while a false negative for C is a case of class C that is classified as some other class. Of course, the total number of errors must come to half the sum of the numbers of false positives and false negatives, since each error is counted twice--as a false negative for its true class, and as a false positive for the predicted class.
For some applications, especially those with many attributes, it may be useful to know how the individual attributes contribute to the classifier. This is shown in the next section:
        Attribute usage:

             90%  TSH
             18%  thyroid surgery
             18%  on thyroxine
             14%  TT4
             13%  T4U
             13%  FTI
              7%  referral source
The figure before each attribute is the percentage of training cases
in hypothyroid.data for which the value of that
attribute is known and is used in predicting a class. The second
entry, for instance, shows that the decision tree uses a known
value of thyroid surgery when classifying 18% of the
training cases. Attributes for which this value is less than 1%
are not shown. Two points are worth noting here:
- These values are computed for the particular classifier and training cases; changing either would give different values.
- When a case is classified, use of an attribute such as
FTIthat is defined by a formula also counts as using any attributes involved in its definition (hereTT4andT4U).
If there are optional unseen test cases, the classifier's performance on these cases is summarized in a format similar to that for the training cases.
            Decision Tree
          ----------------
          Size      Errors

            11    3( 0.3%)   <<


           (a)   (b)   (c)   (d)    <-classified as
          ----  ----  ----  ----
            31     1                (a): class primary
             1    39                (b): class compensated
                                    (c): class secondary
                   1         927    (d): class negative
A very simple majority classifier predicts
that every new case belongs to the most common class in the
training data.
In this example, 2553 of the 2772 training cases belong to class
negative so that
a majority classifier would always opt for
negative.
The 1000 test cases from file
hypothyroid.test
include 928 belonging to class negative,
so a simple
majority classifier would have an error rate of 7.2%.
The decision tree does much better than this with an error rate of 0.3%
on the test cases!
The error rate on the test cases is almost always higher than the rate on the training cases. The later section on cross-validation discusses a more effective way of determining the predictive error rate of a classifier.
The confusion matrix (or false positive/false negative summary if there are more than twenty classes) for the test cases again provides more details on correct and incorrect classifications.
Discrete value subsets
By default, a test on a discrete attributes has a separate branch for each of its values that is present in the data. Tests with a high fan-out can have the undesirable side-effect of fragmenting the data during construction of the decision tree. See5 has a Subset option that can mitigate this fragmentation to some extent: attribute values are grouped into subsets and each subtree is associated with a subset rather than with a single value.
In the hypothyroid example, invoking this option as no effect on the tree produced.
Although it does not help for this application, the Subset option is recommended when there are important discrete attributes that have more than four or five values.
Rulesets
Decision trees can sometimes be quite difficult to understand. An important feature of See5 is its ability to generate classifiers called rulesets that consist of unordered collections of (relatively) simple if-then rules.
The Rulesets option causes classifiers to be expressed as rulesets rather than decision trees, here giving the following:
See5 [Release 2.11a]    Sun Apr  7 08:49:53 2019

    Options:
        Rule-based classifiers

Class specified by attribute `diagnosis'

Read 2772 cases (24 attributes) from hypothyroid.data

Rules:

Rule 1: (31, lift 42.7)
        thyroid surgery = f
        TSH > 6
        TT4 <= 37
        ->  class primary  [0.970]

Rule 2: (63/6, lift 39.3)
        TSH > 6
        FTI <= 65.3
        ->  class primary  [0.892]

Rule 3: (270/116, lift 10.3)
        TSH > 6
        ->  class compensated  [0.570]

Rule 4: (2225/2, lift 1.1)
        TSH <= 6
        ->  class negative  [0.999]

Rule 5: (296, lift 1.1)
        on thyroxine = t
        FTI > 65.3
        ->  class negative  [0.997]

Rule 6: (240, lift 1.1)
        TT4 > 153
        ->  class negative  [0.996]

Rule 7: (29, lift 1.1)
        thyroid surgery = t
        FTI > 65.3
        ->  class negative  [0.968]

Default class: negative


Evaluation on training data (2772 cases):

                Rules
          ----------------
            No      Errors

             7   14( 0.5%)   <<


           (a)   (b)   (c)   (d)    <-classified as
          ----  ----  ----  ----
            60     3                (a): class primary
             1   153                (b): class compensated
                               2    (c): class secondary
             5     3        2545    (d): class negative


        Attribute usage:

             90%  TSH
             20%  TT4
             14%  T4U
             14%  FTI
             11%  on thyroxine
              2%  thyroid surgery


Evaluation on test data (1000 cases):

                Rules
          ----------------
            No      Errors

             7    5( 0.5%)   <<


           (a)   (b)   (c)   (d)    <-classified as
          ----  ----  ----  ----
            32                      (a): class primary
             1    39                (b): class compensated
                                    (c): class secondary
             1     3         924    (d): class negative


Time: 0.0 secs
Each rule consists of:
- A rule number -- this is quite arbitrary and serves only to identify the rule.
- Statistics
(n, liftx)or(n/m, liftx)that summarize the performance of the rule. Similarly to a leaf, n is the number of training cases covered by the rule and m, if it appears, shows how many of them do not belong to the class predicted by the rule. The rule's accuracy is estimated by the Laplace ratio(n-m+1)/(n+2) . The lift x is the result of dividing the rule's estimated accuracy by the relative frequency of the predicted class in the training set. - One or more conditions that must all be satisfied if the rule is to be applicable.
- A class predicted by the rule.
- A value between 0 and 1 that indicates the confidence with which this prediction is made. (Note: The boosting option described below employs an artificial weighting of the training cases; if it is used, the confidence may not reflect the true accuracy of the rule.)
negative,
that is used when none of the rules apply.
Rulesets are generally easier to understand than trees since each rule describes a specific context associated with a class. Furthermore, a ruleset generated from a tree usually has fewer rules than than the tree has leaves, another plus for comprehensibility.
Another advantage of ruleset classifiers is that they can be more accurate predictors than decision trees -- a point not illustrated here, since the ruleset has an error rate of 0.5% on the test cases. For very large datasets, however, generating rules with the Ruleset option can require considerably more computer time.
For a given application, the attribute usage shown for a decision tree and for a ruleset can be a bit different. In the case of the tree, the attribute at the root is always used (provided its value is known) while an attribute further down the tree is used less frequently. For a ruleset, an attribute is used to classify a case if it is referenced by a condition of at least one rule that applies to that case; the order in which attributes appear in a ruleset is not relevant.
Rule utility ordering
The order of rules does not matter, so the default is to group them by class and sub-ordered them by confidence. An alternative ordering by estimated contribution to predictive accuracy can be selected using the Sort by utility option. Under this option, the rule that most reduces the error rate on the training data appears first and the rule that contributes least appears last. Furthermore, results are reported in a selected number of bands so that the predictive accuracies of the more important subsets of rules are also estimated. For example, if the Sort by utility option with four bands is selected, the hypothyroid rules are reordered as
Rule 1: (2225/2, lift 1.1)
        TSH <= 6
        ->  class negative  [0.999]

Rule 2: (270/116, lift 10.3)
        TSH > 6
        ->  class compensated  [0.570]

Rule 3: (63/6, lift 39.3)
        TSH > 6
        FTI <= 65.3
        ->  class primary  [0.892]

Rule 4: (296, lift 1.1)
        on thyroxine = t
        FTI > 65.3
        ->  class negative  [0.997]

Rule 5: (240, lift 1.1)
        TT4 > 153
        ->  class negative  [0.996]

Rule 6: (29, lift 1.1)
        thyroid surgery = t
        FTI > 65.3
        ->  class negative  [0.968]

Rule 7: (31, lift 42.7)
        thyroid surgery = f
        TSH > 6
        TT4 <= 37
        ->  class primary  [0.970]
The rules are divided into four bands of roughly equal sizes
and a further summary is generated for both training and test cases.
Here is the output for test cases:
Evaluation on test data (1000 cases):

                Rules
          ----------------
            No      Errors

             7    5( 0.5%)   <<


           (a)   (b)   (c)   (d)    <-classified as
          ----  ----  ----  ----
            32                      (a): class primary
             1    39                (b): class compensated
                                    (c): class secondary
             1     3         924    (d): class negative

Rule utility summary:

        Rules         Errors
        -----         ------
        1-2        56( 5.6%)
        1-4        10( 1.0%)
        1-5         6( 0.6%)
This shows that,
when only the first two rules are used,
the error rate on the test cases is 5.6%,
dropping to 1.0% when the first four rules are used,
and so on. The performance of the entire ruleset is not
repeated since it is shown above the utility summary.
Rule utility orderings are not given for cross-validations (see below).
Boosting
Another powerful feature incorporated in See5 is adaptive boosting, based on the work of Rob Schapire and Yoav Freund. The idea is to generate several classifiers (either decision trees or rulesets) rather than just one. When a new case is to be classified, each classifier votes for its predicted class and the votes are counted to determine the final class.
But how can we generate several classifiers from a single dataset?
As the first step, a single decision tree or ruleset is constructed
as before from the training data (e.g. hypothyroid.data).
This classifier will usually make mistakes on some cases in the data;
the first decision tree, for instance, gives the wrong class
for 8 cases in hypothyroid.data.
When the second classifier is constructed, more attention is paid
to these cases in an attempt to get them right.
As a consequence, the second classifier will generally be different
from the first. It also will make errors on some cases,
and these become more important during construction
of the third classifier.
This process continues for a pre-determined number of iterations
or trials, but stops if the most recent classifiers is
either extremely accurate or too inaccurate.
The Boost option with x trials instructs See5 to construct up to x classifiers in this manner. Naturally, constructing multiple classifiers requires more computation that building a single classifier -- but the effort can pay dividends! Trials over numerous datasets, large and small, show that 10-classifier boosting reduces the error rate for test cases by an average 25%.
Selecting the Boost option with 10 trials causes ten decision trees to be generated. The summary of the trees' individual and aggregated performance on the 1000 test cases is:
Trial       Decision Tree
-----     ----------------
          Size      Errors

   0        11    3( 0.3%)
   1         5   63( 6.3%)
   2         8   17( 1.7%)
   3         9    6( 0.6%)
   4        12  119(11.9%)
   5        14   15( 1.5%)
   6         8   54( 5.4%)
   7        11   22( 2.2%)
   8        15   36( 3.6%)
   9        17   23( 2.3%)
boost             2( 0.2%)   <<


           (a)   (b)   (c)   (d)    <-classified as
          ----  ----  ----  ----
            32                      (a): class primary
                  40                (b): class compensated
                                    (c): class secondary
             1     1         926    (d): class negative
The performance of the classifier constructed at each trial
is summarized on a separate line, while the line labeled
boost
shows the result of voting all the classifiers.
The decision tree constructed on Trial 0 is identical to that produced without the Boost option. Some of the subsequent trees produced by paying more attention to certain cases have relatively high overall error rates. Nevertheless, when the trees are combined by voting, the final predictions have a lower error rate of 0.2% on the test cases.
Warning: An important characteristic of datasets is the extent to which they are affected by noise -- incorrectly recorded values of attributes or the class, or inherent probabilistic variability in the classes themselves. Boosting is particularly effective when the data are relatively noise-free (such as the hypothyroid application), but can be counterproductive for noisy datasets.
Winnowing attributes
The decision trees and rulesets constructed by See5 do not generally use all of the attributes. The hypothyroid application has 22 predictive attributes (plus a class and a label attribute) but only five of them appear in the tree and the ruleset. This ability to pick and choose among the predictors is an important advantage of tree-based modeling techniques.
Some applications, however, have an abundance of attributes! For instance, one approach to text classification describes each passage by the words that appear in it, so there is a separate attribute for each different word in a restricted dictionary.
When there are numerous alternatives for each test in the tree or ruleset, it is likely that at least one of them will appear to provide valuable predictive information. In applications like these it can be useful to pre-select a subset of the attributes that will be used to construct the decision tree or ruleset. The See5 mechanism to do this is called "winnowing" by analogy with the process for separating wheat from chaff (or, here, useful attributes from unhelpful ones).
Winnowing is not obviously relevant for the hypothyroid application since there are relatively few attributes. To illustrate the idea, however, here are the results when the Winnowing option is invoked:
See5 [Release 2.11a]    Sun Apr  7 08:52:49 2019

    Options:
        Winnow attributes

Class specified by attribute `diagnosis'

Read 2772 cases (24 attributes) from hypothyroid.data

14 attributes winnowed
Estimated importance of remaining attributes:

    990%  TSH
    270%  FTI
    200%  on thyroxine
     30%  thyroid surgery
     <1%  age
     <1%  T3
     <1%  TT4
     <1%  referral source

Decision tree:

TSH <= 6: negative (2472/2)
TSH > 6:
:...FTI <= 65.3:
    :...thyroid surgery = t:
    :   :...FTI <= 38.2: negative (2.1)
    :   :   FTI > 38.2: primary (2.1/0.1)
    :   thyroid surgery = f:
    :   :...TT4 <= 61: primary (51/3.7)
    :       TT4 > 61:
    :       :...referral source in {WEST,SVHD}: primary (0)
    :           referral source in {STMW,SVHC,SVI}: primary (4.9/0.8)
    :           referral source = other:
    :           :...TSH <= 22: negative (6.4/2.7)
    :               TSH > 22: primary (5.8/0.8)
    FTI > 65.3:
    :...on thyroxine = t: negative (37.7)
        on thyroxine = f:
        :...thyroid surgery = t: negative (6.8)
            thyroid surgery = f:
            :...TT4 > 153: negative (6/0.1)
                TT4 <= 153:
                :...TT4 <= 37: primary (2.5/0.2)
                    TT4 > 37: compensated (174.6/24.8)


Evaluation on training data (2772 cases):

            Decision Tree
          ----------------
          Size      Errors

            12    6( 0.2%)   <<


           (a)   (b)   (c)   (d)    <-classified as
          ----  ----  ----  ----
            60     3                (a): class primary
                 154                (b): class compensated
                               2    (c): class secondary
                   1        2552    (d): class negative


        Attribute usage:

             90%  TSH
             18%  thyroid surgery
             18%  on thyroxine
             14%  TT4
             13%  T4U
             13%  FTI
              7%  referral source


Evaluation on test data (1000 cases):

            Decision Tree
          ----------------
          Size      Errors

            12    3( 0.3%)   <<


           (a)   (b)   (c)   (d)    <-classified as
          ----  ----  ----  ----
            31     1                (a): class primary
             1    39                (b): class compensated
                                    (c): class secondary
                   1         927    (d): class negative


Time: 0.0 secs
After analyzing the training cases and before the decision
tree is built, See5 winnows 14 of the 22 predictive attributes.
This has the same effect as marking the attributes as excluded
by an entry in the names file; winnowed attributes
can still be used in the definition of other attributes.
In this example, T4U is winnowed but is still available
for use in the definition of FTI.
The remaining attributes are then listed in order of importance, See5's estimate of the factor by which the true error rate or misclassification cost would increase if that attribute were excluded. If TSH were excluded, for example, See5 expects the error rate on unseen test cases to increase to 3% (990% of the current rate of 0.3%). This estimate is only a rough guide and should not be taken too literally!
We then see the decision tree that is constructed from the reduced set of attributes. In this case it is slightly more elaborate than the original tree but has the same error rate on the test cases.
Since winnowing the attributes can be a time-consuming process, it is recommended primarily for larger applications (100,000 cases or more) where there is reason to suspect that many of the attributes have at best marginal relevance to the classification task.
Soft thresholds
The top of our initial decision tree tests whether
the value of the attribute TSH is less than or
equal to, or greater than, 6. If the former holds, we go no further
and predict that the case's class is negative, otherwise
we perform further tests before making a decision.
Thresholds like this are sharp, so that a case with
a hypothetical value of 5.99 for TSH is treated
quite differently from one with a value of 6.01.
For some domains, this sudden change is quite appropriate -- for instance, there are hard-and-fast cutoffs for bands of the income tax table. For other applications, though, it is more reasonable to expect classification decisions to change more slowly near the thresholds.
Each threshold in a decision tree actually consists of three parts -- a lower bound lb, an upper bound ub, and an intermediate value t, the threshold shown in the original decision tree. If the attribute value in question is below lb or above ub, classification is carried out using the single branch corresponding to the `<=' or '>' result respectively. If the value lies between lb and ub, both branches of the tree are investigated and the results combined. The relative weight of the '<=' branch (green) and the '>' branch (blue) as the value of the attribute varies is shown in this figure:
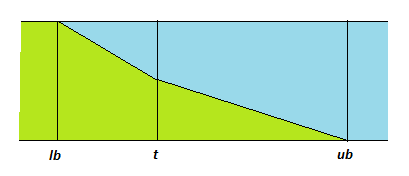
Selecting the Show soft thresholds option displays all the information about each threshold and gives the following decision tree:
TSH <= 6 (6): negative (2472/2)
TSH >= 6.1 (6):
:...FTI <= 61 (65.3):
    :...thyroid surgery = t: negative (4.2/2)
    :   thyroid surgery = f:
    :   :...TT4 <= 44 (61): primary (51/3.7)
    :       TT4 >= 63 (61):
    :       :...referral source in {WEST,SVHD}: primary (0)
    :           referral source in {STMW,SVHC,SVI}: primary (4.9/0.8)
    :           referral source = other:
    :           :...TSH <= 14 (22): negative (6.4/2.7)
    :               TSH >= 44 (22): primary (5.8/0.8)
    FTI >= 66 (65.3):
    :...on thyroxine = t: negative (37.7)
        on thyroxine = f:
        :...thyroid surgery = t: negative (6.8)
            thyroid surgery = f:
            :...TT4 >= 159 (153): negative (6/0.1)
                TT4 <= 146 (153):
                :...TT4 <= 14 (37): primary (2.5/0.2)
                    TT4 >= 61 (37): compensated (174.6/24.8)
Each threshold is now of the form
<= lb (t)
or
>= ub (t).
If a case has a value of the relevant attribute that is
between lb and t, both
branches are explored and the results combined with the relative weight of
the <= branch ranging from 1 to 0.5. Similarly, if a
case has a value between t and ub, the
relative weight of the <= branch ranges from 0.5 to 0.
A final point: soft thresholds affect only decision tree classifiers -- they do not change the interpretation of rulesets.
Advanced pruning options
Three further options enable aspects of the classifier-generation process to be tweaked. These are best regarded as advanced options that should be used sparingly (if at all), so that this section can be skipped without much loss.
See5 constructs decision trees in two phases. A large tree is first grown to fit the data closely and is then `pruned' by removing parts that are predicted to have a relatively high error rate. This pruning process is first applied to every subtree to decide whether it should be replaced by a leaf or sub-branch, and then a global stage looks at the performance of the tree as a whole.
Turning off the default Global pruning option disables this second pruning component and generally results in larger decision tees and rulesets. For the hypothyroid application, the tree increases in size from 11 to 12 leaves. (Turning off global pruning can be beneficial for smaller applications with many discrete attributes.)
The Pruning CF option affects the way that error rates are estimated and hence the severity of pruning; values smaller than the default (25%) cause more of the initial tree to be pruned, while larger values result in less pruning.
The Minimum cases option constrains the degree to which the initial tree can fit the data. At each branch point in the decision tree, the stated minimum number of training cases must follow at least two of the branches. Values higher than the default (2 cases) can lead to an initial tree that fits the training data only approximately -- a form of pre-pruning. (This option is complicated by the presence of missing attribute values, and by the use of differential misclassification costs or weighting of individual cases as discussed elsewhere. All cause adjustments to the apparent number of cases following a branch.)
Sampling from large datasets
Even though See5 is relatively fast, building classifiers from large numbers of cases can take an inconveniently long time, especially when options such as boosting are employed. See5 incorporates a facility to extract a random sample from a dataset, construct a classifier from the sample, and then test the classifier on a disjoint collection of cases. By using a smaller set of training cases in this way, the process of generating a classifier is expedited, but at the cost of a possible reduction in the classifier's predictive performance.
The Sample option with x% has two consequences. Firstly, a random sample containing x% of the cases in the application's data file is used to construct the classifier. Secondly, the classifier is evaluated on a non-overlapping set of test cases consisting of another (disjoint) sample of the same size as the training set (if x is less than 50%), or all cases that were not used in the training set (if x is greater than or equal to 50%).
In the hypothyroid example,
using a sample of 60% would cause a classifier to be constructed
from a randomly-selected 1663 of the 2772 cases in
hypothyroid.data, then tested on the
remaining 1109 cases.
By default, the random sample changes every time that a classifier is constructed, so that successive runs of See5 with sampling will usually produce different results. This re-sampling can be avoided by selecting the Lock sample option that uses the current sample for constructing subsequent classifiers. If this option is selected, the sample will change only when another application is loaded, the sample percentage is altered, the option is unselected, or See5 is restarted.
Cross-validation trials
As we saw earlier, the performance of a classifier on the training
cases from which it was constructed gives a poor estimate of
its accuracy on new cases.
The true predictive accuracy of the classifier can be estimated
by sampling, as above, or by using a separate test file;
either way, the classifier is evaluated on cases that were
not used to build it.
However, this estimate can be unreliable unless the numbers of
cases used to build and evaluate the classifier are both large.
If the cases in hypothyroid.data and
hypothyroid.test were to be shuffled
and divided into a new 2772-case training set and a 1000-case test set,
See5 might construct a different classifier with a lower or higher error
rate on the test cases.
One way to get a more reliable estimate of predictive accuracy is by f-fold cross-validation. The cases (including those in the test file, if it exists) are divided into f blocks of roughly the same size and class distribution. For each block in turn, a classifier is constructed from the cases in the remaining blocks and tested on the cases in the hold-out block. In this way, each case is used just once as a test case. The error rate of a classifier produced from all the cases is estimated as the ratio of the total number of errors on the hold-out cases to the total number of cases.
The Cross-validation option with f folds runs such a f-fold cross-validation. Suppose now that we select the Cross-validation option with 10 folds together with the Rulesets option. After giving details of the individual rulesets, the output shows a summary like this:
Fold            Rules
----      ----------------
            No      Errors

   1         7        0.5%
   2         7        0.3%
   3         7        0.5%
   4         8        0.5%
   5         8        1.6%
   6         7        0.5%
   7         7        0.0%
   8         7        0.0%
   9         7        0.3%
  10         7        0.8%

  Mean     7.2        0.5%
  SE       0.1        0.1%


           (a)   (b)   (c)   (d)    <-classified as
          ----  ----  ----  ----
            91     4                (a): class primary
                 192           2    (b): class compensated
                               2    (c): class secondary
             5     6        3470    (d): class negative
This estimates the error rate of the rulesets
produced from the
2772 cases in hypothyroid.data
at 0.5%.
The SE figures (the standard errors of the means)
provide an estimate of the variability of these results.
The cross-validation procedure can be repeated for different random partitions of the cases into blocks. The average error rate from these distinct cross-validations is then an even more reliable estimate of the error rate of the single classifier produced from all the cases.
Since every cross-validation fold produces a different classifier using only part of the application's data, running a cross-validation does not cause a classifier to be saved. To save a classifier for later use, simply run See5 without employing cross-validation.
Differential misclassification costs
Up to this point, all errors have been treated as equal -- we have simply counted the number of errors made by a classifier to summarize its performance. Let us now turn to the situation in which the `cost' associated with a classification error depends on the predicted and true class of the misclassified case.
See5 allows costs to be assigned to any combination of predicted and
true class via entries in the optional file
filestem.costs.
Each entry has the form
predicted class,true class:cost
where cost is any non-negative value. The file may contain any number of entries; if a particular combination is not specified explicitly, its cost is taken to be 0 if the predicted class is correct and 1 otherwise.
To illustrate the idea, suppose that it was a much more serious
error to classify a hypothyroid patient as negative
than the converse.
A hypothetical costs file hypothyroid.costs
might look like this:
negative, primary: 7.5
negative, secondary: 5
negative, compensated: 5
This specifies that the cost of misclassifying any
primary patient as negative is 7.5,
and any
secondary, or
compensated
patient as negative is 5.
Since they are not given explicitly, all other errors
have cost 1.
In other words, failing to identify a sick patient is more costly.
A costs file is automatically read by See5 unless the system is told to ignore it. The output from the system using default options now looks like this:
See5 [Release 2.11a]    Sun Apr  7 08:56:12 2019

    Options:
        Application `hypothyroid'

Class specified by attribute `diagnosis'

Read 2772 cases (24 attributes) from hypothyroid.data
Read misclassification costs from hypothyroid.costs

Decision tree:

TSH <= 6:
:...TT4 > 55: negative (2444.3)
:   TT4 <= 55:
:   :...query hypothyroid = f: negative (25.7/1)
:       query hypothyroid = t: secondary (2.1/1.1)
TSH > 6:
:...FTI <= 65.3:
    :...thyroid surgery = f: primary (68.1/11.7)
    :   thyroid surgery = t:
    :   :...FTI <= 38.2: negative (2.1)
    :       FTI > 38.2: primary (2.1/0.1)
    FTI > 65.3:
    :...on thyroxine = t: negative (37.7)
        on thyroxine = f:
        :...thyroid surgery = t: negative (6.8)
            thyroid surgery = f:
            :...TT4 > 153: negative (6/0.1)
                TT4 <= 153:
                :...TT4 <= 37: primary (2.5/0.2)
                    TT4 > 37: compensated (174.6/24.8)


Evaluation on training data (2772 cases):

               Decision Tree
          -----------------------
          Size      Errors   Cost

            11   12( 0.4%)   0.01   <<


           (a)   (b)   (c)   (d)    <-classified as
          ----  ----  ----  ----
            60     3                (a): class primary
             1   153                (b): class compensated
                         1     1    (c): class secondary
             5     1     1  2546    (d): class negative


        Attribute usage:

             94%  TT4
             90%  TSH
             18%  thyroid surgery
             18%  on thyroxine
             13%  T4U
             13%  FTI
              8%  query hypothyroid


Evaluation on test data (1000 cases):

               Decision Tree
          -----------------------
          Size      Errors   Cost

            11    4( 0.4%)   0.00   <<


           (a)   (b)   (c)   (d)    <-classified as
          ----  ----  ----  ----
            32                      (a): class primary
             1    39                (b): class compensated
                                    (c): class secondary
             1     2         925    (d): class negative


Time: 0.0 secs
The original tree and new tree are quite similar, but we can
compare the total cost of misclassified
cases for the two trees.
For the training cases, the original tree had cost 29
(two primary and two secondary
cases are classified as negative and there are
four other errors, so 2*7.5 + 2*5 + 4). The new tree
classifies one secondary case as negative
and makes 11 other errors for a total cost of 16.
Unfortunately, the new tree makes one additional error on the test cases
and so is of no benefit in this example.
The new "Cost" column in the output shows the average misclassification cost, i.e. the total cost divided by the number of cases. For the new tree, the average cost is 16/2772 for the training cases and 4/1000 for the test cases.
Weighting individual cases
It is sometimes useful to attach different weights to cases depending on some measure of their importance. An application predicting whether a customer is likely to "churn," for example, might weight training cases by the size of the account.
See5 accommodates this by allowing a special attribute that contains
the weight of each case. The attribute name must be
case weight and
it must be of type continuous. The relative weight
assigned to each case is its value of this attribute divided by
the average value; if the value is undefined ("?"),
not applicable ("N/A"), or is less than or equal to zero,
the case's relative weight is set to 1.
The case weight attribute itself is not used in the classifier!
Our sample hypothyroid application does not have any natural case-by-case
weighting, since all patients are equal. For the purpose of illustration,
though, we will add an implicitly-defined attribute to
hypothyroid.names as follows:
case weight := 100-age.
TSH <= 6: negative (2462.5/2.3)
TSH > 6:
:...FTI <= 64: primary (69.6/12.8)
    FTI > 64:
    :...on thyroxine = t: negative (39.6)
        on thyroxine = f:
        :...thyroid surgery = t: negative (9.2)
            thyroid surgery = f:
            :...TT4 > 153: negative (6.2/0.2)
                TT4 <= 153:
                :...TT4 > 61: compensated (179/29.3)
                    TT4 <= 61:
                    :...TSH <= 35: compensated (2.8/0.3)
                        TSH > 35: primary (3.2/0.3)
The case counts at the leaves now reflect the relative weights
of the cases. (The counts associated with rules are affected similarly.)
However, the error counts, rates, and costs shown in the evaluations
use uniform case weighting.
A cautionary note: The use of case weighting does not guarantee that the classifier will be more accurate for unseen cases with higher weights. Predictive accuracy on more important cases is likely to be improved only when cases with similar values of the predictor attributes also have similar values of the case weight attribute, i.e. when relatively important cases "clump together." Without this property, case weighting can introduce an unhelpful element of randomness into the classifier generation process.
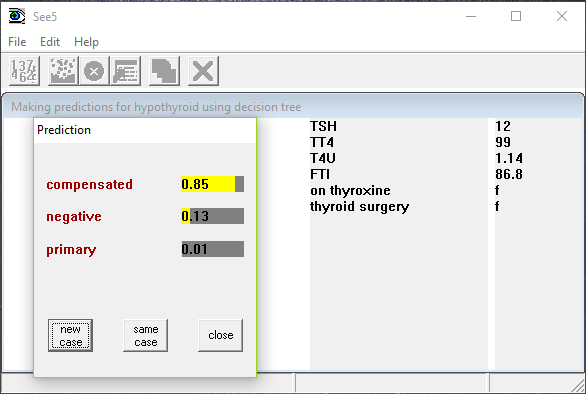
Using Classifiers
Once a classifier has been constructed, an interactive interpreter can be used to predict the classes to which new cases belong. The Use Classifier button invokes the interpreter, using the most recent classifier for the current application, and prompts for information about the case to be classified. Since the values of all attributes may not be needed, the attribute values requested will depend on the case itself. When all the relevant information has been entered, the most likely class (or classes) are shown, each with a confidence value. For example, this is the result of analyzing a case using the first decision tree above:
Classifiers can also be used in batch mode. The sample application provided in the public source code reads cases from a cases file and shows the predicted class and the confidence for each.
Cross-Referencing Classifiers and Data
See5 incorporates a way to link cases and the
relevant sections of (possibly boosted) classifiers.
We will illustrate this facility using the first decision tree
for the hypothyroid application and the cases in hypothyroid.data
from which it was constructed.
The Cross-Reference button brings up a window showing the most recent classifier for the current application and how it relates to the cases in the data, test or cases file. (If more than one of these is present, a menu will prompt you to select the file.)
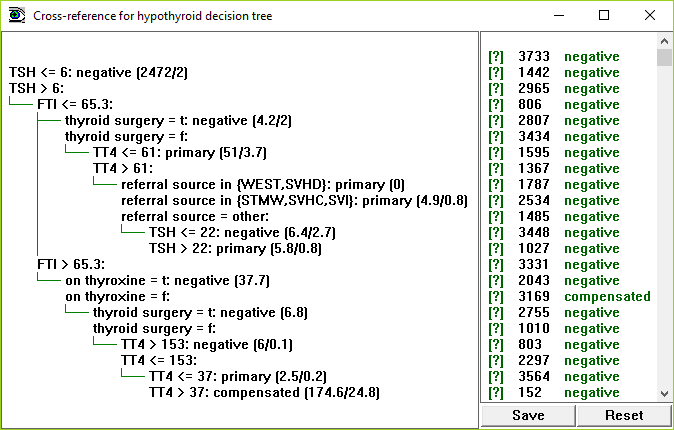
The window is divided into two panes, with the classifier on the left and a list of cases on the right. The Reset button can be used at any time to restore the window to this initial state.
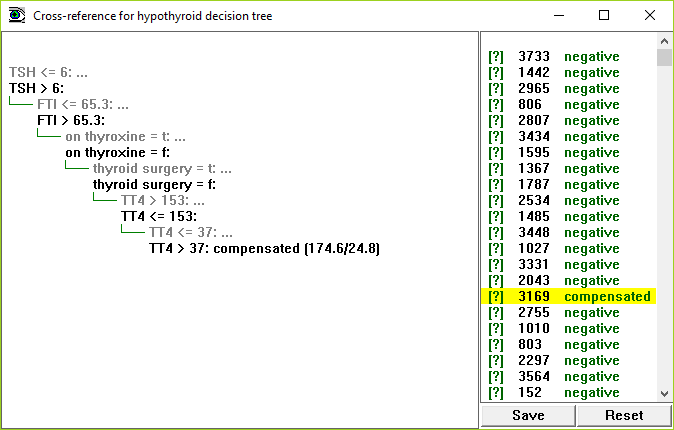
Each case has a [?] tag (that is red if the case is misclassified), an identifying number or label, and the class predicted for the case (also red when incorrect). Clicking on the tag [?] in front of a case number or label displays that case:
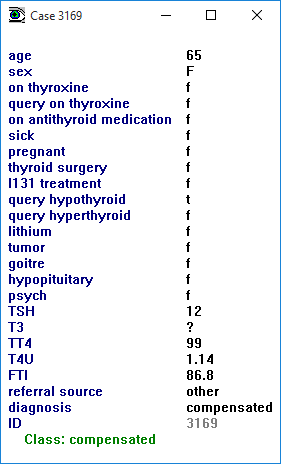
Back in the main window, clicking on a case's label or number shows the part(s) of the classifier(s) relevant to that case. For instance, clicking on case 3169 shows the leaf to which this case is mapped:
If a case has missing values for one or more attributes, a value of a tested continuous attribute between the lower and upper threshold limits, if it is covered by several rules, or if boosted classifiers are used, more than one leaf or rule may be relevant to a case. In such situations, all relevant parts of the classifier are shown.
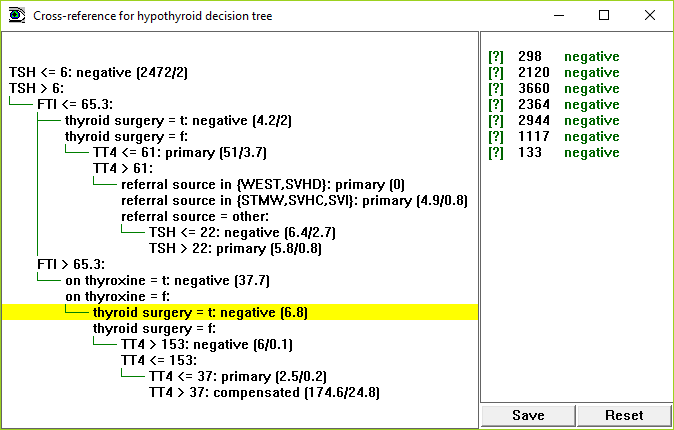
Click on any leaf or rule, and all the cases that map to the leaf or rule are shown. For instance, clicking on Reset and then the leaf indicated shows all cases that are covered by that leaf:
The Save button preserves the details of the displayed classifier and case list as an ASCII file selected through a dialog box.
Generating Classifiers in Batch Mode
The See5 distribution includes a program See5X that
can be used to produce classifiers non-interactively.
This console application resides in the same folder as See5
(usually C:\Program Files\See5 for single-computer licences
or the See5 folder on your desktop for network licences)
and is invoked from
an MS-DOS Prompt window.
Before using See5X:
- cd to the folder containing the application files
- create a new shortcut to
C:\Program Files\See5\See5X.exe(for single-computer licensees) orSee5\See5X.exeon your desktop for network licensees
The command to run the program is:
start /B See5X.exe.lnk -f filestem parameters
where the parameters enable one or more options discussed above to
be selected:
-s
| use the Subset option |
-r
| use the Ruleset option |
-u bands
| sort rules by their utility into bands |
-b
| use the Boosting option with 10 trials |
-t trials
| ditto with specified number of trials |
-w
| winnow attributes before constructing a classifier |
-S x
| use the Sampling option with x% |
-I seed
| set the sampling seed value |
-X folds
| carry out a cross-validation |
-g
| turn off the global tree pruning stage |
-c CF
| set the Pruning CF value |
-m cases
| set the Minimum cases |
-p
| use the Show soft thresholds option |
-e
| ignore any costs file |
If desired, output from See5 can be diverted to a file in the usual way.
Linking to Other Programs
The classifiers generated by See5 are retained in files
filestem.tree (for decision trees) and
filestem.rules (for rulesets).
Free C source code is available
to read these classifier files and to make predictions with them,
enabling you to use See5 classifiers in other
programs.
As an example, the source includes a program sample.c to input new cases
and to show how each is classified
by boosted or single trees or rulesets.
The program reads the application's names file, the
tree or rules file generated by See5,
and an optional costs file. It then reads cases from
a cases file in a format similar to a data
file, except that a case's class can be given as `?' meaning
"unknown". For each case, the program outputs the given class, the class
predicted by the classifier, and the confidence with which this prediction
is made.
Please see the file sample.c for compilation
instructions and program options.
Click here to download a zip archive containing the public source code.
| © RULEQUEST RESEARCH 2019 | Last updated April 2019 |
| home | products | download | evaluations | prices | purchase | contact us |